Week 1
An Introduction to Quantitative Sociology
Soci—269
Getting Started
First Order of Business
The First of Many Group Exercises
Four Broad Questions
What’s your name?
What are your majors?
Why did you sign up for this class?
What does sociology mean to you?
First Order of Business
Now, it’s my turn.
An Odd Introduction
My Journey
The Broad View
My Journey
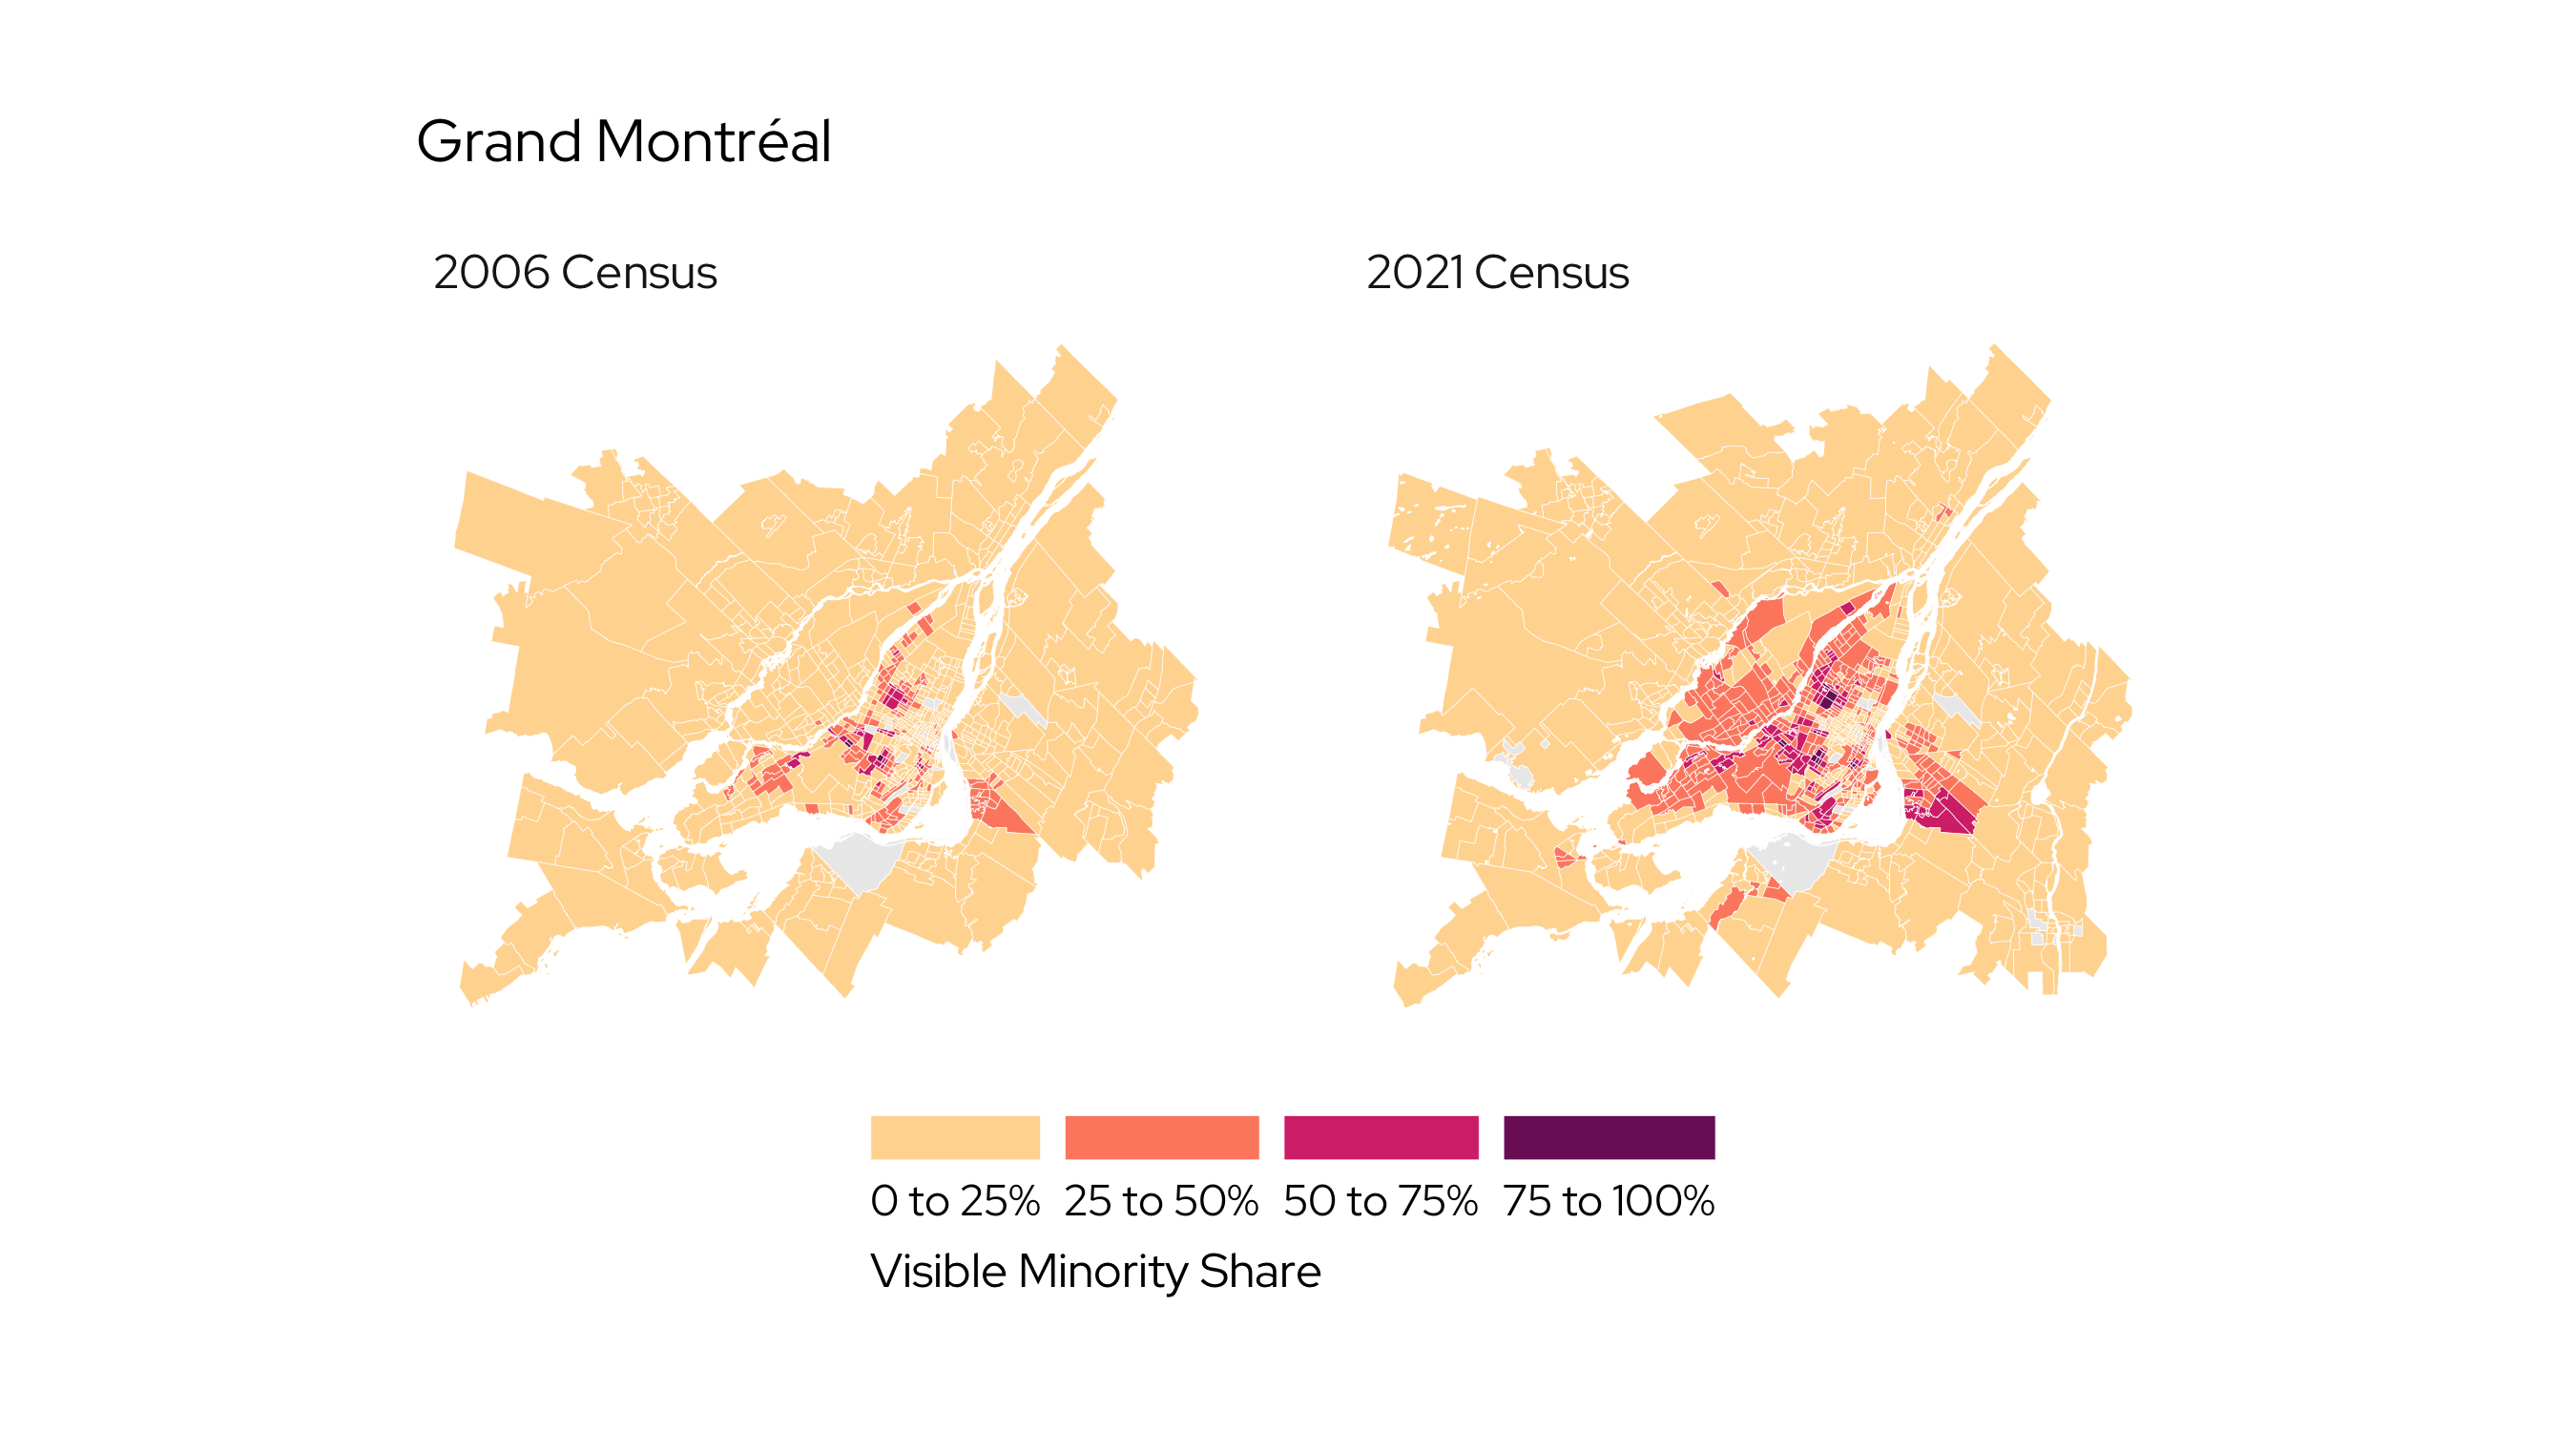
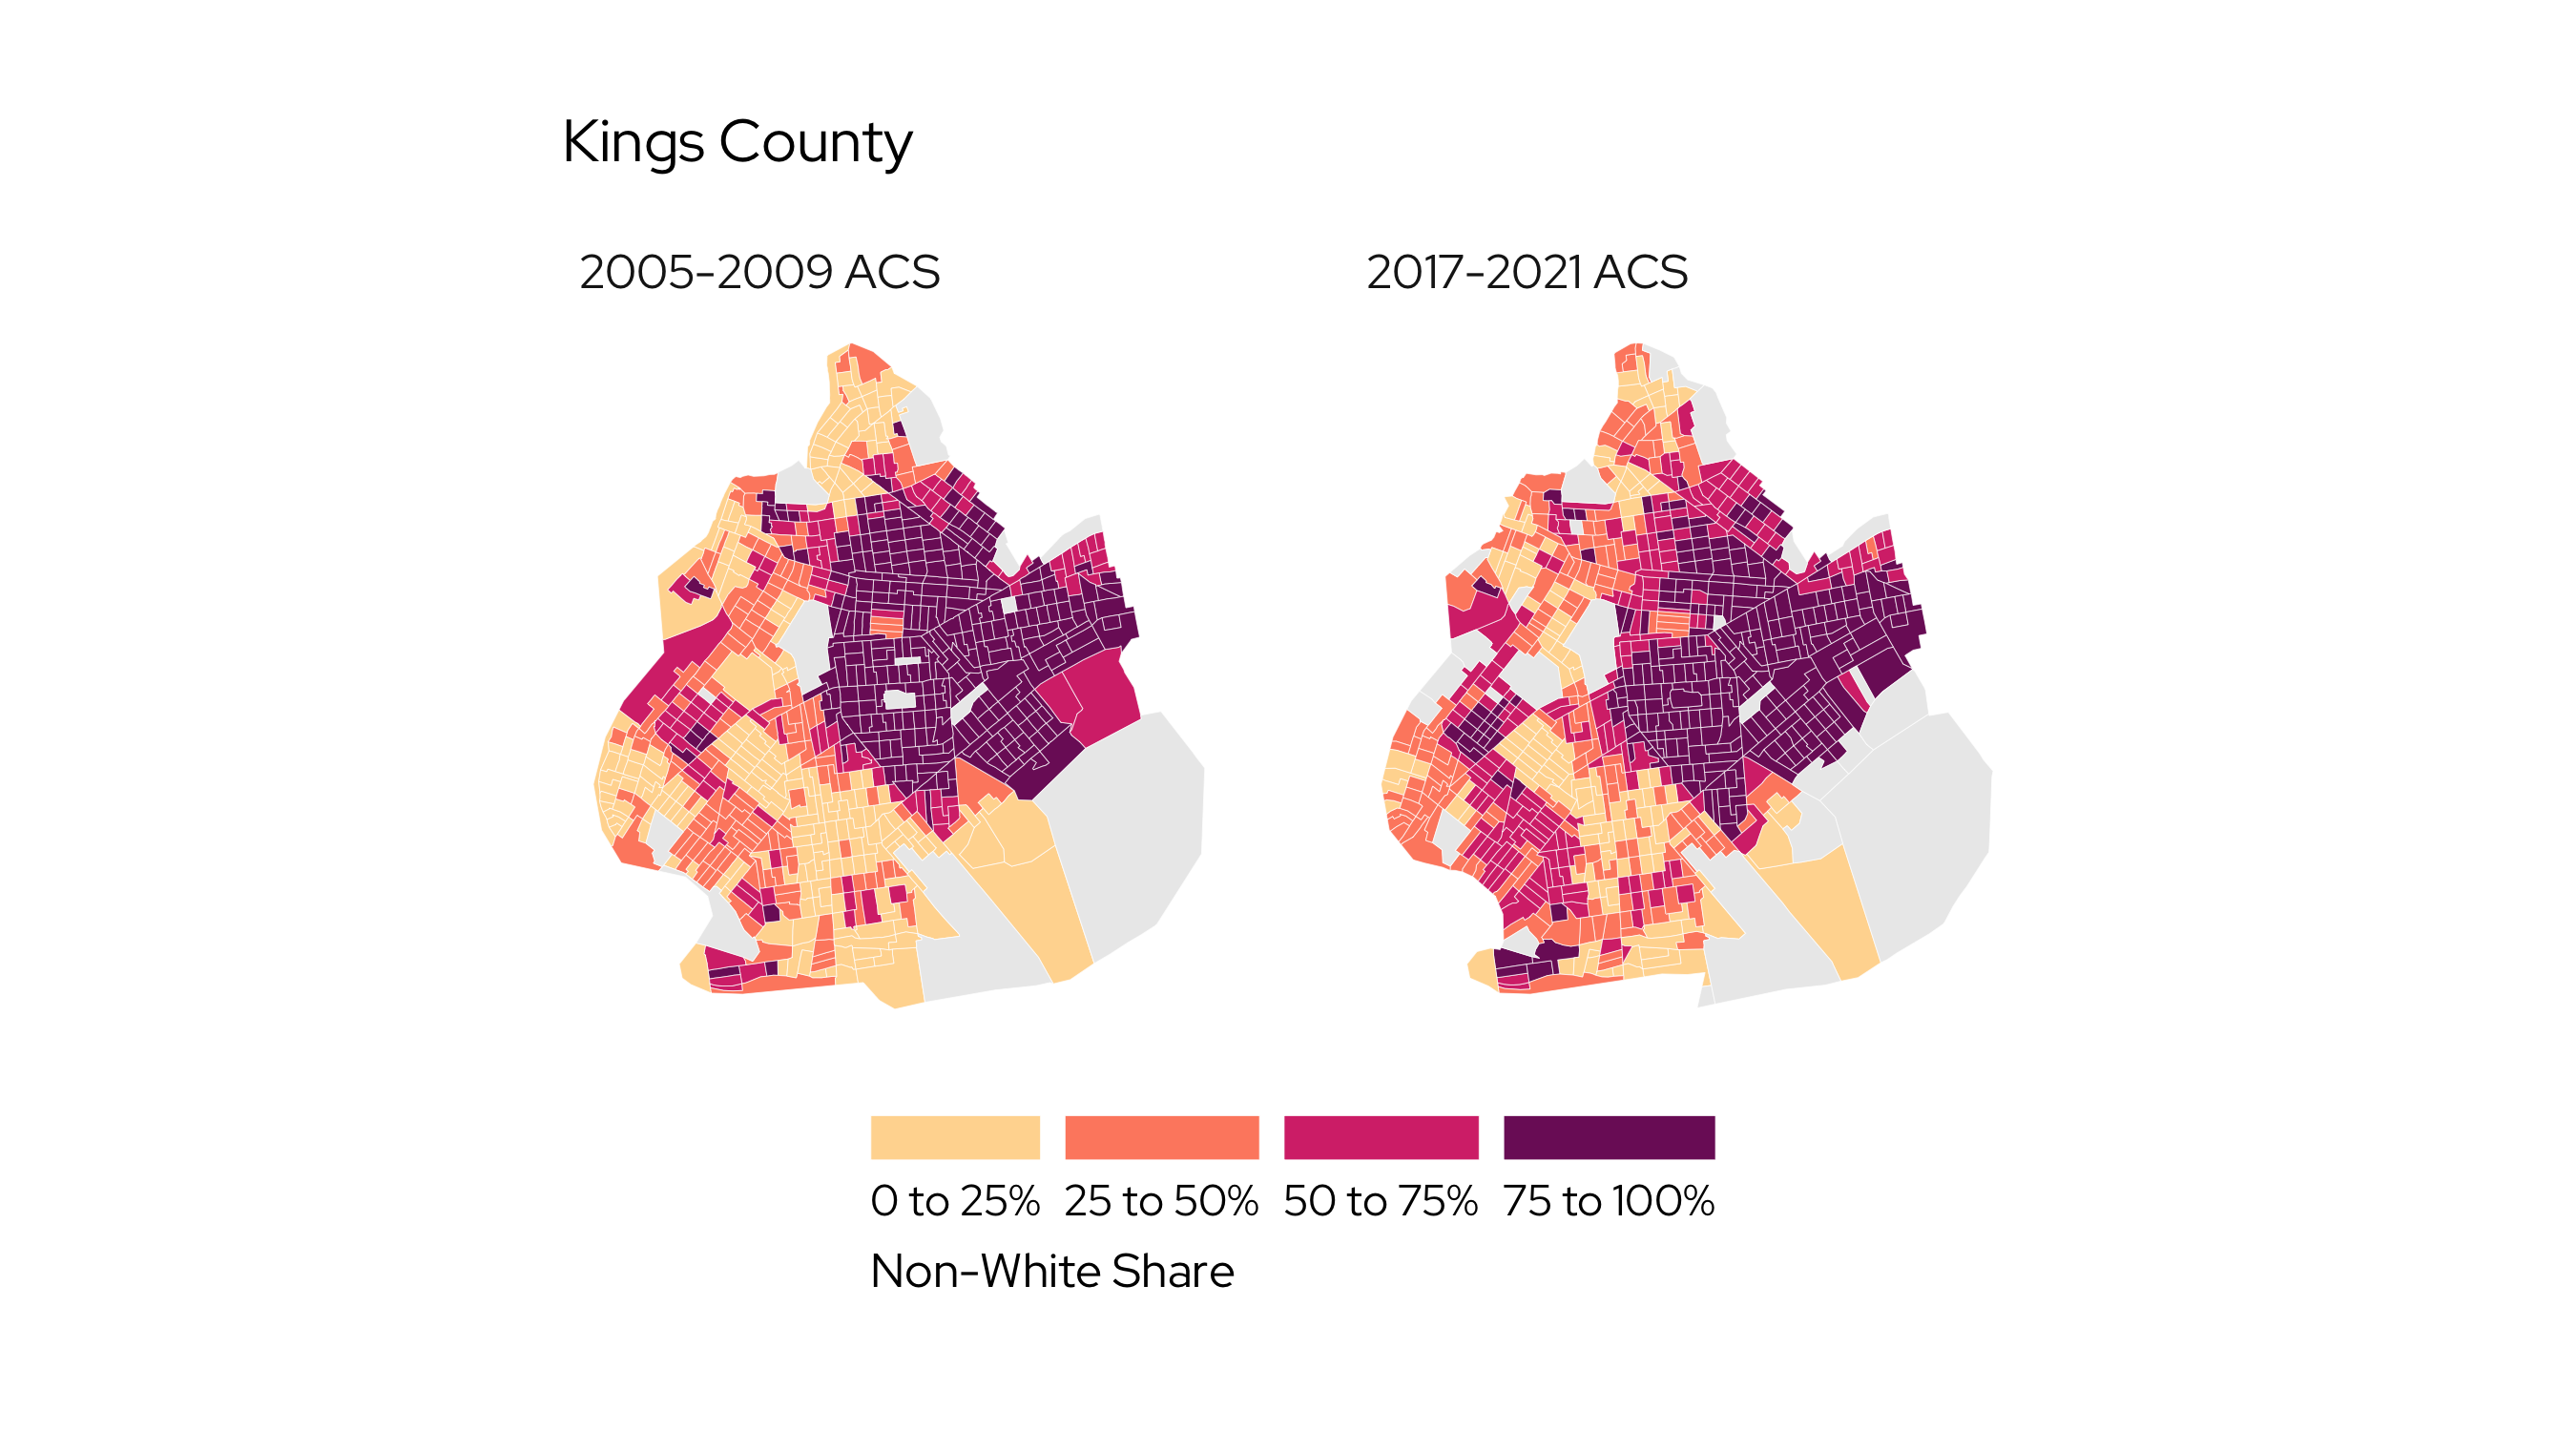
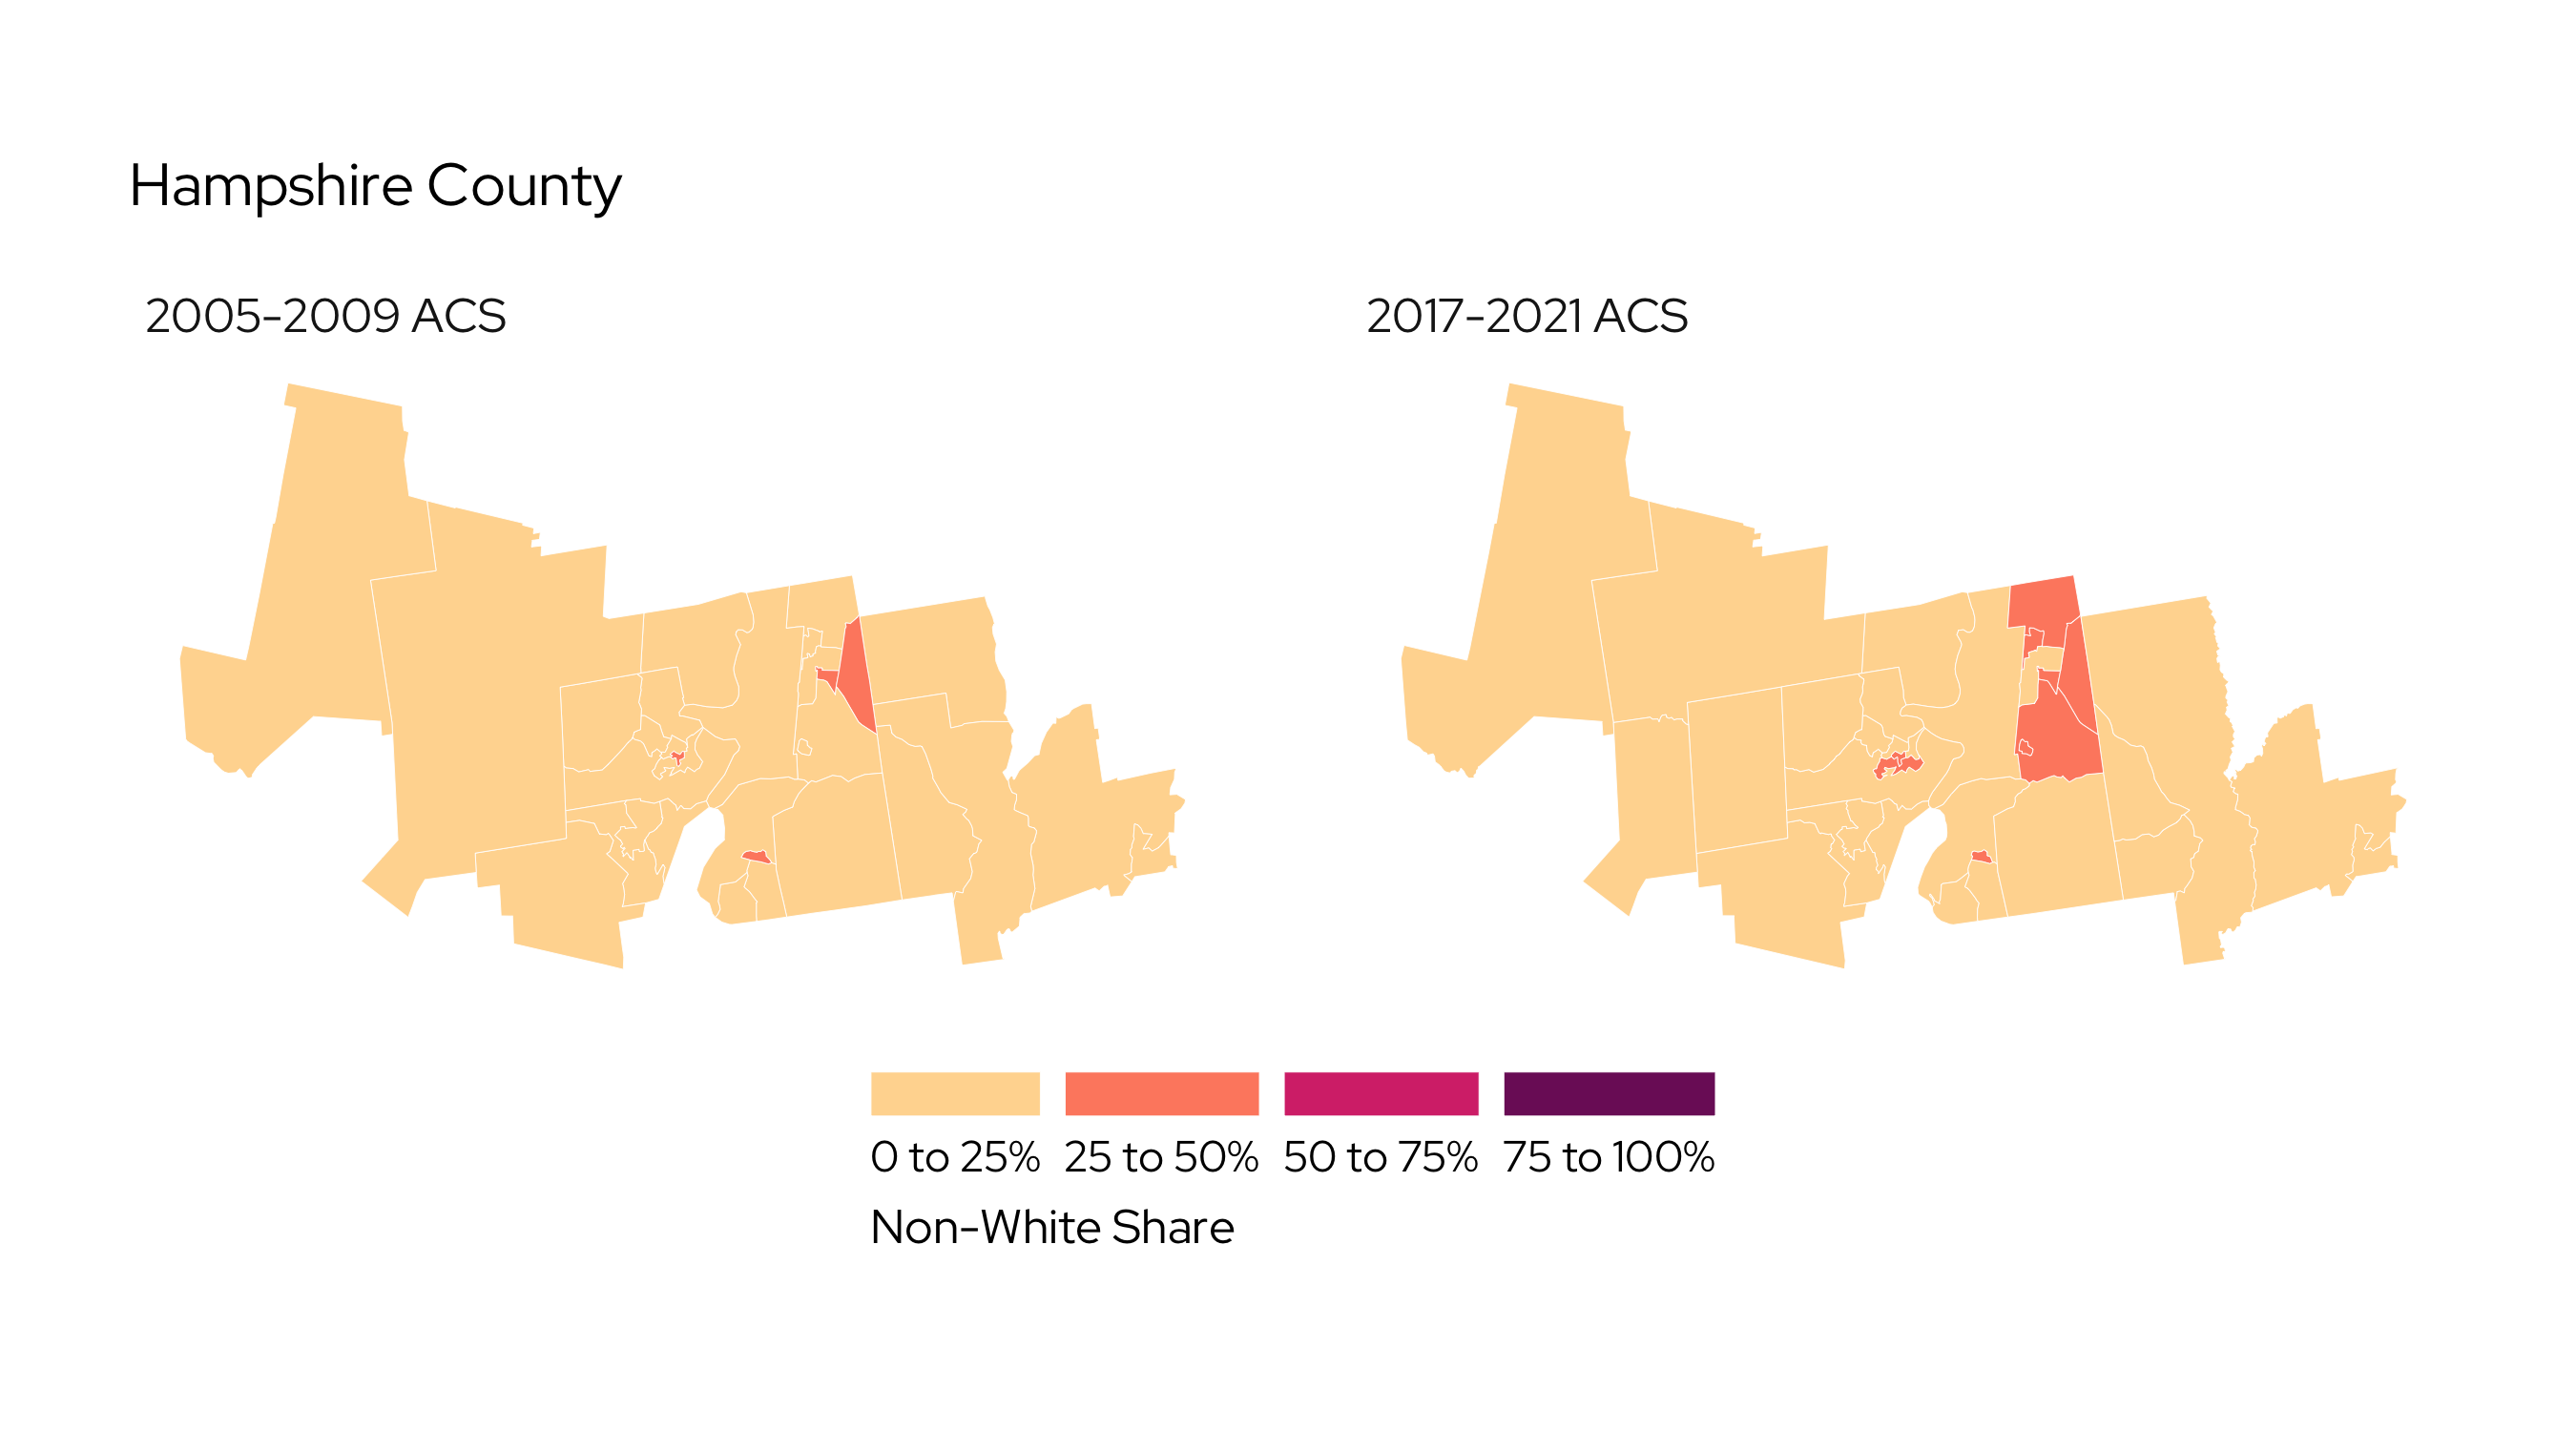
Places Defined By International Migration
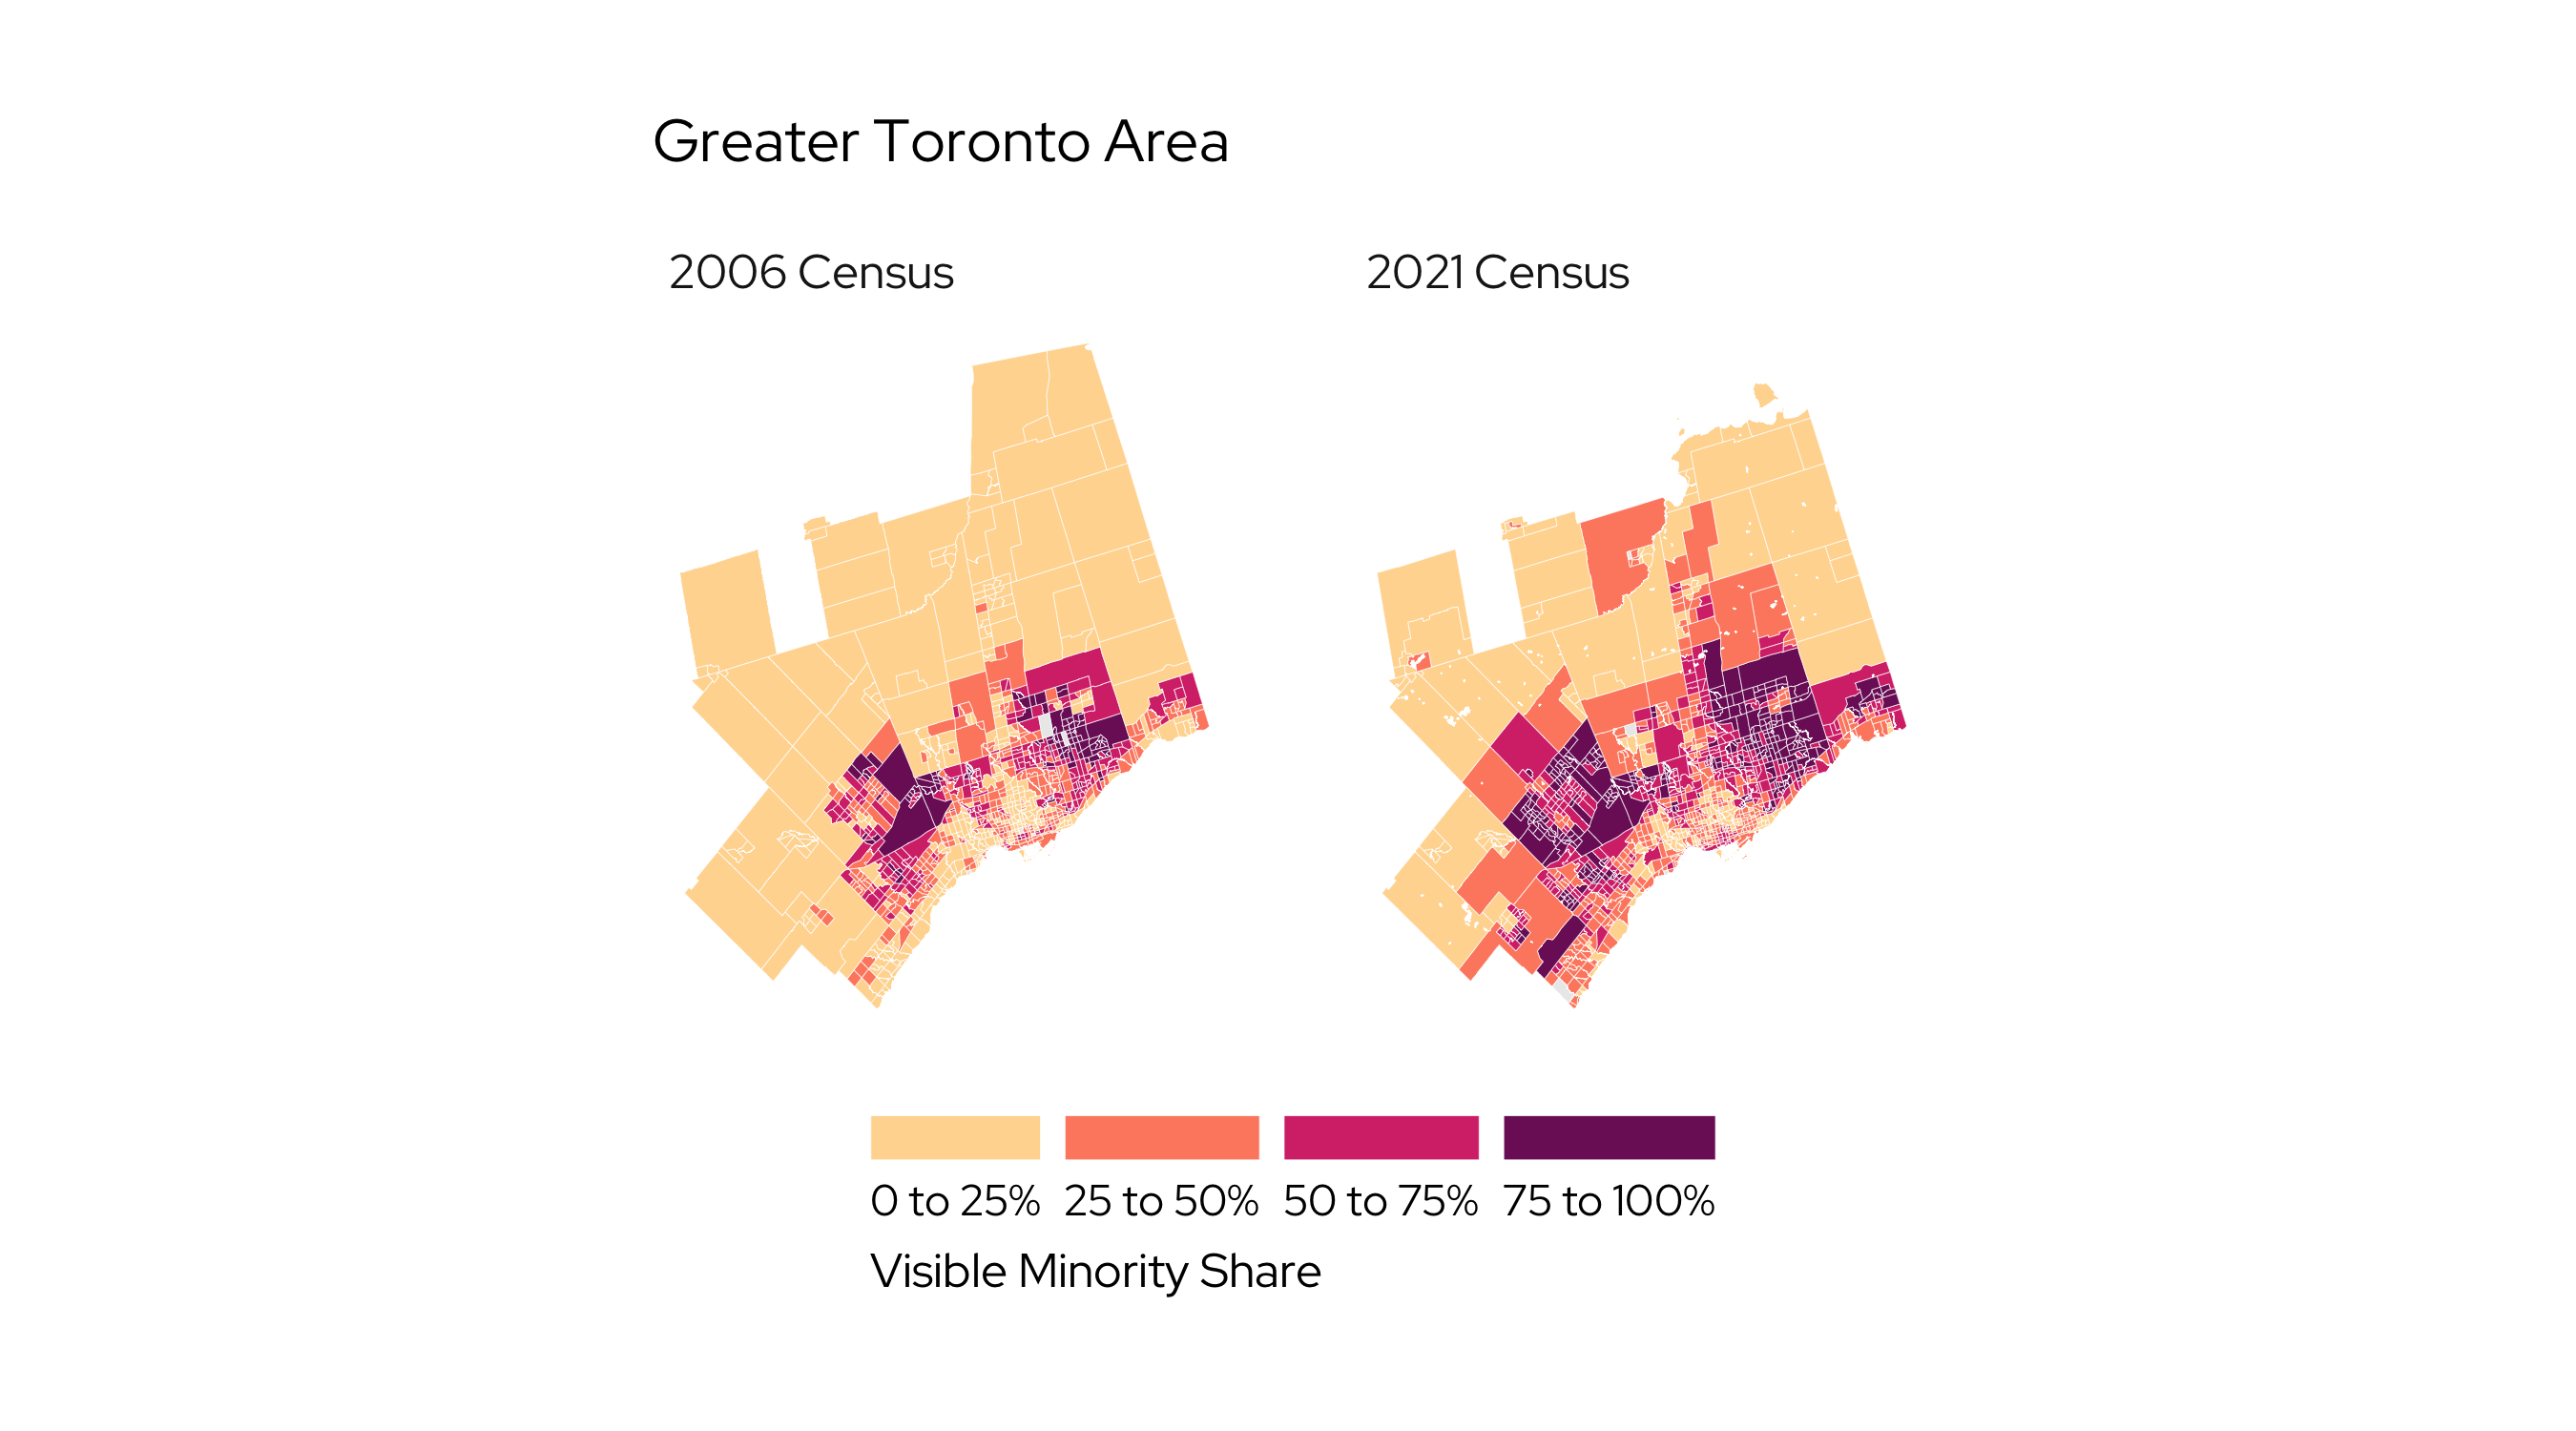
Click Image to Launch Gallery
My Research
Personal Culture of Immigrant-Origin People
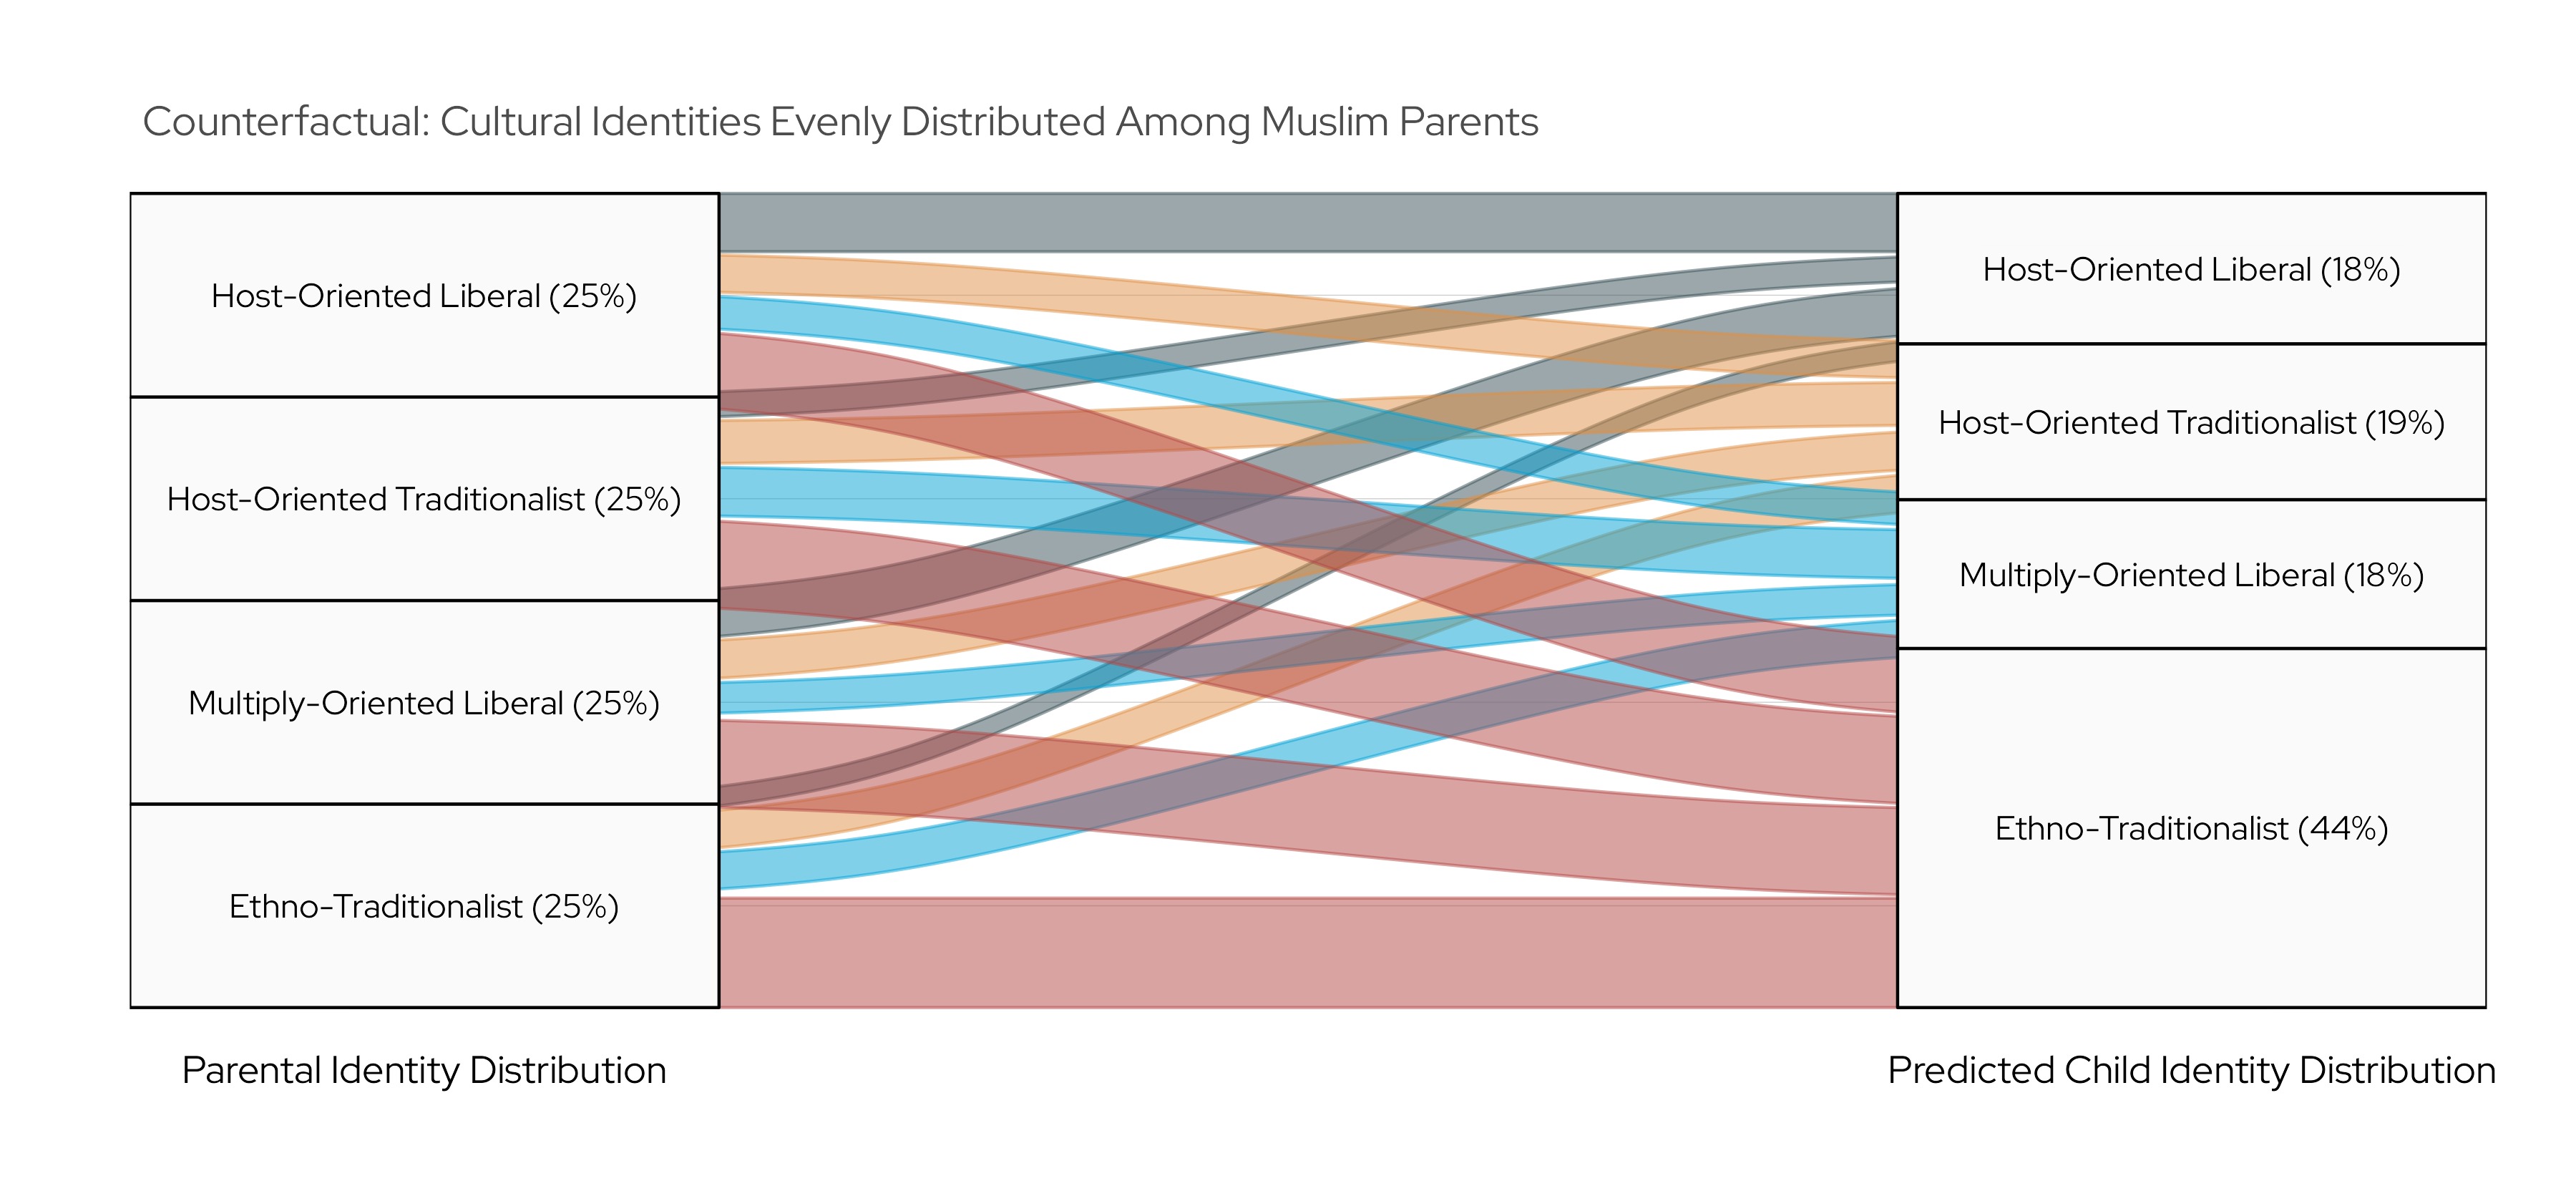
Figure 8 from Karim (2024a)
My Research
Personal Culture of Immigrant-Origin People
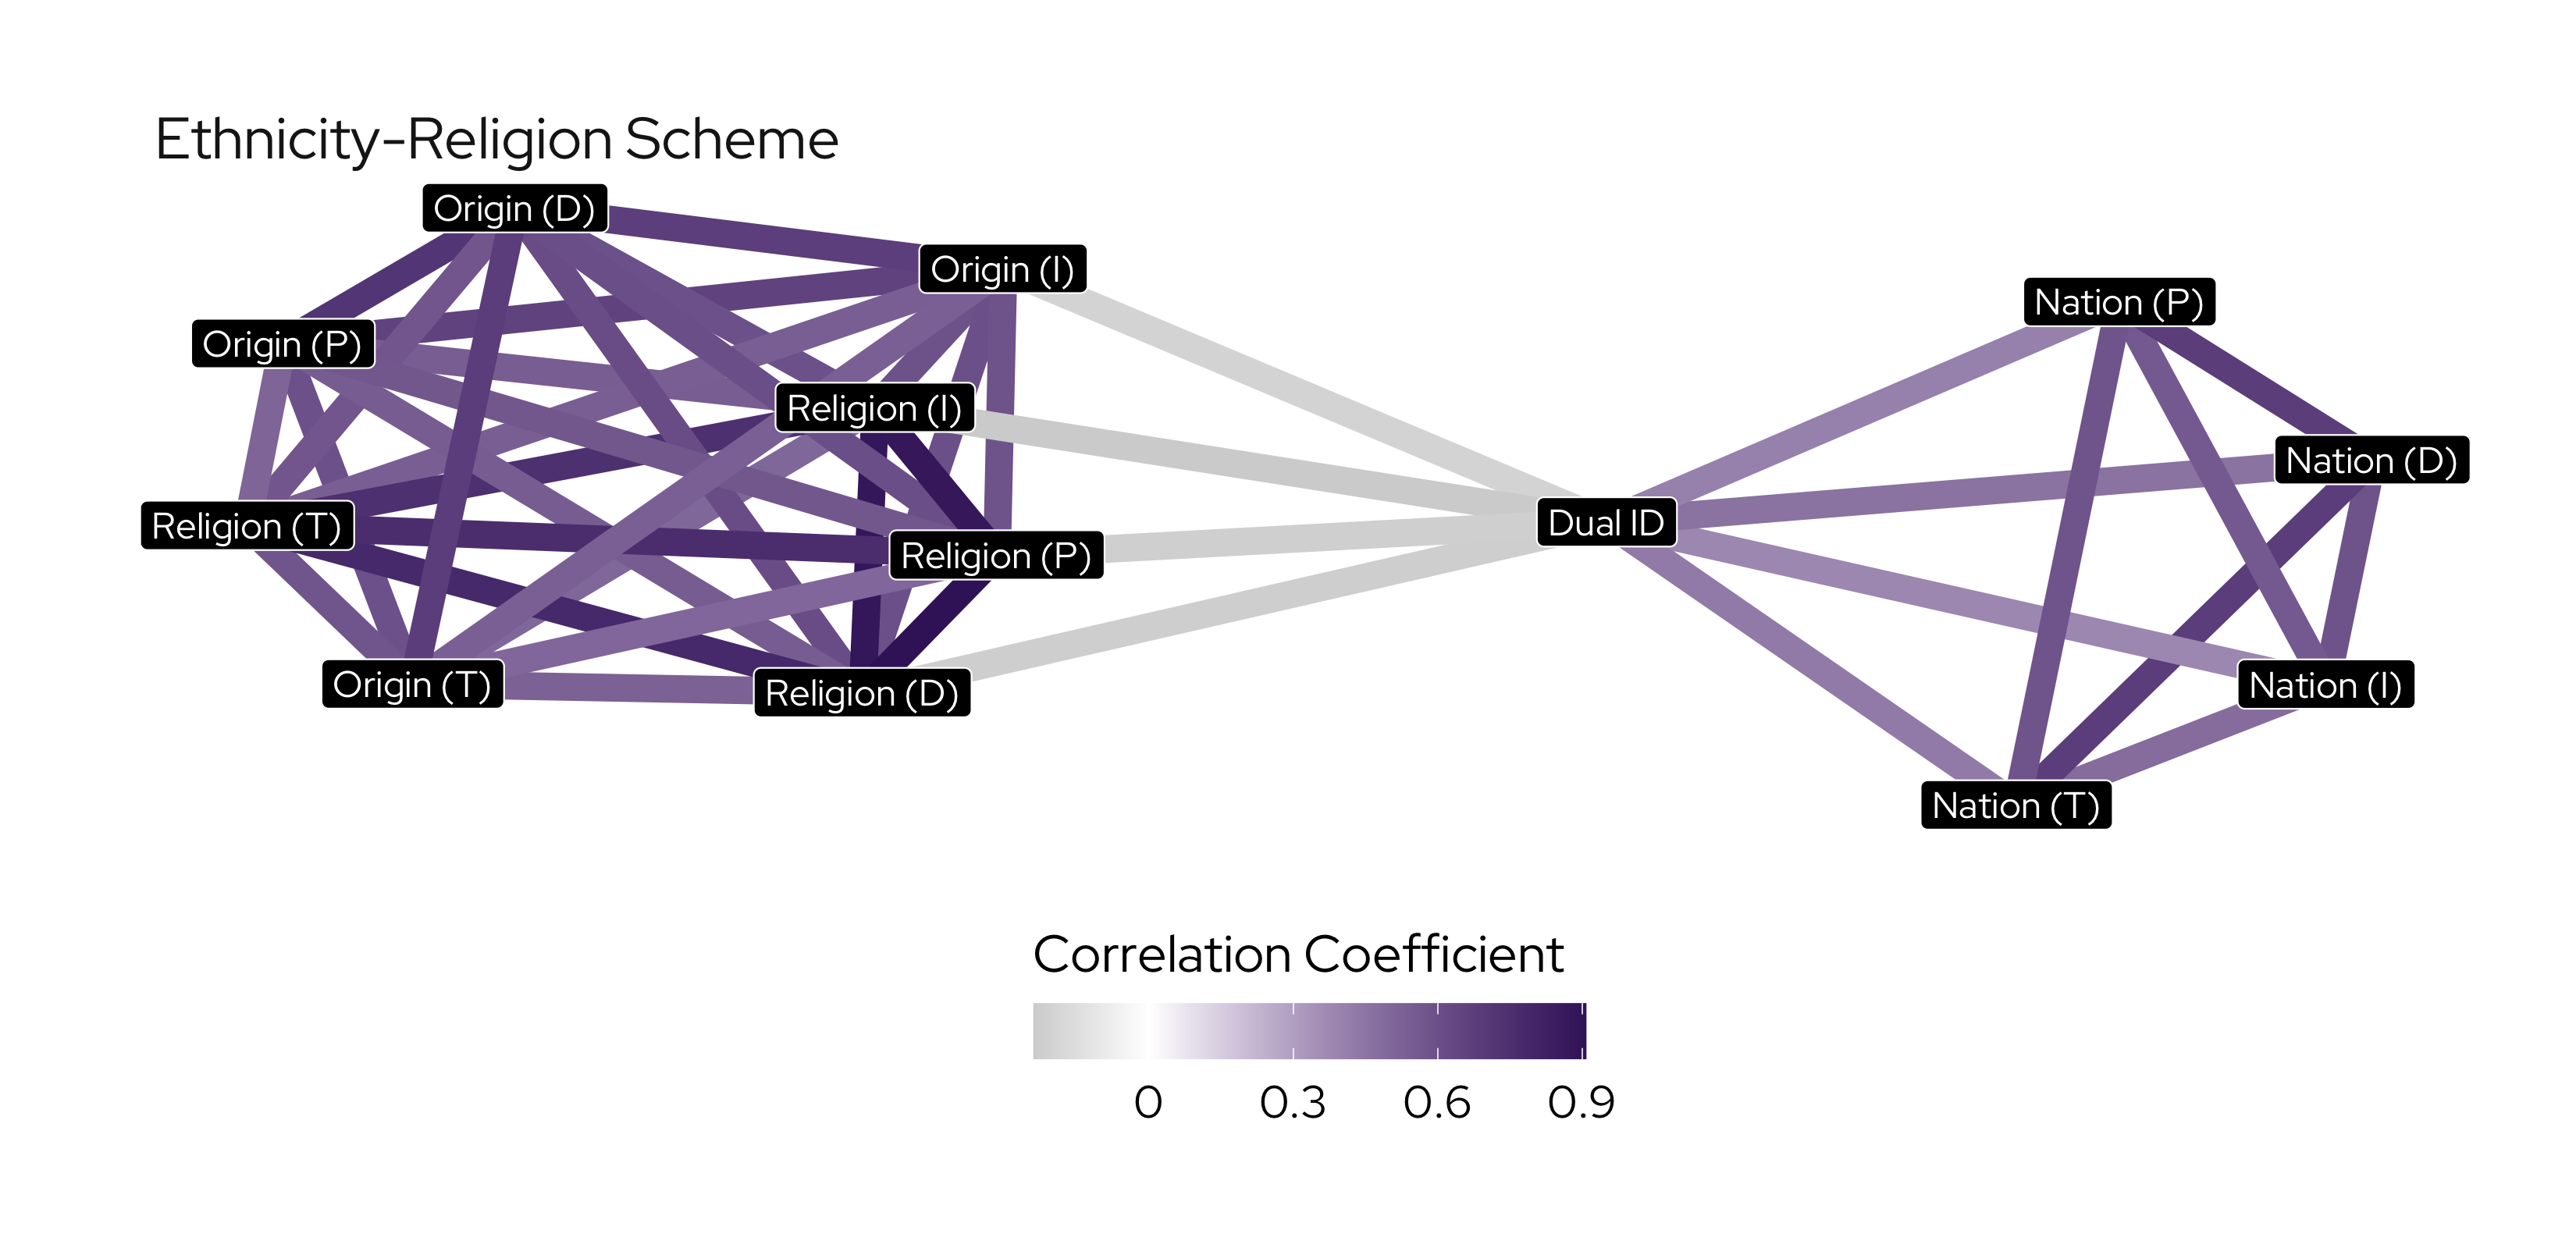
Adaptation of results from Karim (2024b)
My Research
Exclusionary Politics
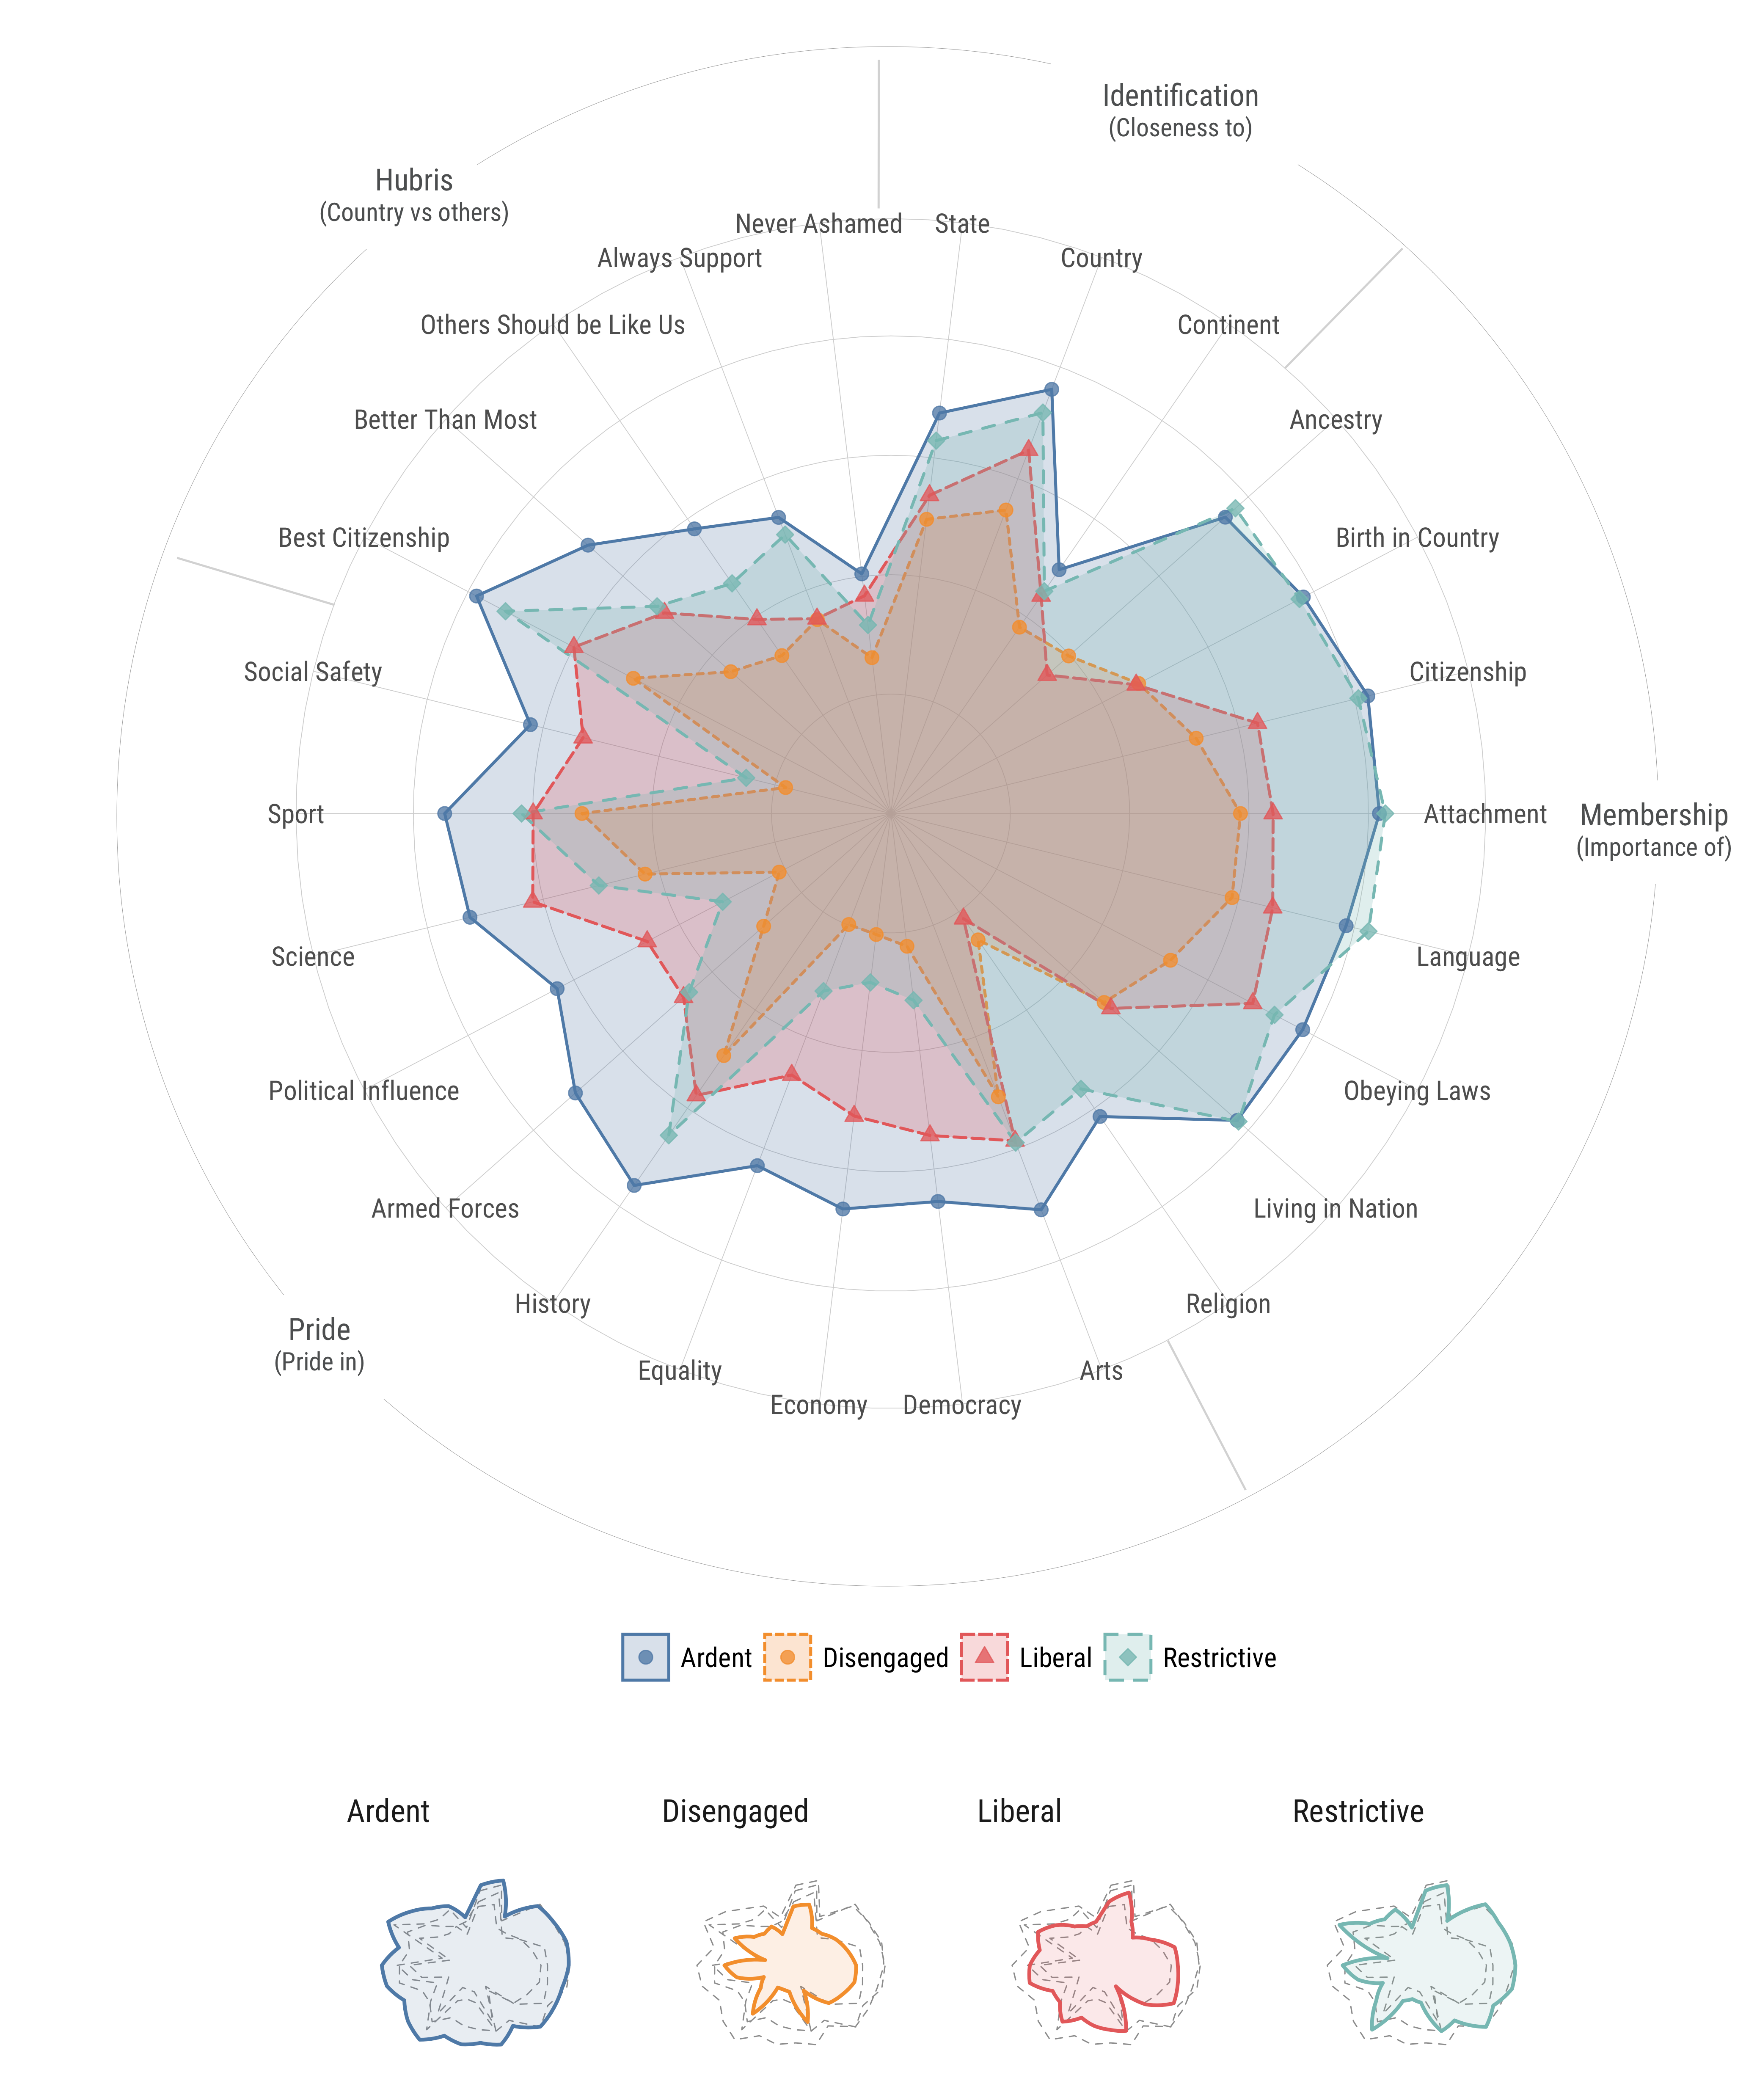
Figure 1 from Soehl and Karim (2021)
My Research
Exclusionary Politics
Karim and Lukk’s The Radicalization of Mainstream Parties in the 21st Century
This Class
The Syllabus
The Syllabus
Office Hours
Fridays, 9—11 AM in Morgan Hall, Room 306
Office Hours
Appointment Policy
All meetings, even during office hours, must be scheduled in
advance via Google Calendar.
Readings
| Data Visualization: A Practical Introduction (Healy 2019) |
| Python for Data Analysis: Data Wrangling with Pandas, NumPy, and Jupyter (McKinney 2022) |
| R for Data Science: Import, Tidy, Transform, Visualize, and Model Data (Wickham, Çetinkaya-Rundel, and Grolemund 2023) |
| ggplot2: Elegant Graphics for Data Analysis (Wickham, Navarro, and Pedersen 2025) |
Course Readings
All course readings can be accessed via our eReserves page on Moodle.
Course Structure
The course consists of four distinct modules.
Course Structure
| Module I will spotlight applied quantitative research published in many of sociology’s flagship journals. |
| Module II will provide a comprehensive introduction to the programming language for statistical computing and visualization. |
Module III introduces the powerful Python programming language. |
| Module IV will feature a series of in-class presentations. |
Evaluations
Note: Scroll to access the entire table
| Task | Description | Weight | Deadline or Evaluative Time Horizon |
|---|---|---|---|
| Response Memos | During Module I, students must engage with, and respond to, questions posed on our Moodle Discussion Board. Responses must be between 250–400 words, or a penalty will be applied. Students are free to “skip” one week (i.e., by not submitting a memo) without incurring a penalty. | 10% | 8:00 PM on Mondays. Evaluated from Weeks 2 to 5. |
| Participation | Students must actively participate in class discussions by raising their hand to share their thoughts, assisting peers when needed, or meaningfully contributing to small group conversations. | 10% | Evaluated during class sessions throughout the term. |
| Coding Assignment in | Students must—either individually or in groups of two—submit their first coding assignment in late October. For this assignment, they will use to clean data from the General Social Survey; report descriptive statistics; create data visualizations using ggplot2; and provide a 5-10-page interpretation of their results (double-spaced, 12-point font). Students must also include their script file (i.e., a .R document) as part of their submission. Additional assignment instructions will be provided at a later date. |
20% | Thursday, October 30th at 8:00 PM. |
| Coding Assignment in Python |
Students must—either individually or in groups of two—submit their second coding assignment in late November. For this assignment, they will use Python to clean data from the American National Election Studies; report descriptives; create data visualizations using seaborn; and provide a 5-10-page summary of their results (double-spaced, 12-point font). Students must also include their code (e.g., a .ipynb document) as part of their submission. Additional instructions will be provided later in the term. |
20% | Friday, November 21st at 8:00 PM. |
| Final Paper Presentation |
Students will deliver a 7–10-minute presentation based on, or informed by, their term paper. A rubric detailing my basic expectations will be posted later in the term. | 10% | During Module IV of our class. |
| Final Paper | Drawing on the applied examples featured in Module I, students must submit a 10-15-page term paper (double-spaced, 12-point-font) on a topic broadly related to (i) gender and sexuality; (ii) race, ethnicity, and nation; (iii) class and social stratification; or (iv) culture. To earn an A, students must also submit companion data visualizations using data from the General Social Survey or the American National Election Studies. Students are free to create these visualizations in either or Python . A rubric detailing my basic expectations will be uploaded later in the term. |
30% | Wednesday, December 17th at 8:00 PM. |
Evaluations
Guidelines for Major Assignments
Guidelines for the three key deliverables will be gradually rolled out (or uploaded online) as deadlines come into focus.
Norms, Rules, Regulations & More
Accessibility and Accommodations
If you require accommodations, please contact Student Accessibility Services as soon as possible and submit an application through the AIM Portal. More generally, if you have any suggestions about how this class can be more accessible and inclusive, please let me know via e-mail or during office hours.
Norms, Rules, Regulations & More
Class Policies
Please review the Amherst College Honor Code, which can be accessed in its entirety here.
Violations of the Honor Code will be promptly reported to the Dean of Students. As Section 1.1 of the Honor Code indicates, plagiarism is a serious offense. In most cases, students who plagiarize the work of others will fail this class and may face additional disciplinary penalties. Moreover, as detailed in Sections 1.2 to 1.4 of the Honor Code, students must respect others in the classroom, including those whose views deviate from their own. Failure to do so will prompt disciplinary action.
There is no reason to pretend like generative artificial intelligence (GAI) does not exist in the world out there. These systems have arrived, and they may revolutionize how higher education “works.” With this in mind, you are free to use ChatGPT and its analogues for class assignments—but you have to cite the GAI you are using.
Failure to do so amounts to plagiarism.
To reiterate:
Generative AI Policy
If you use a GAI tool (like ChatGPT) and do not cite it, it is a form of plagiarism.
You are expected to attend each and every class. If you do not, you will lose points for participation. That said, I am aware that you are all human beings whose lives are often fraught with uncertainty. If something comes up, please let me know and I will do my best to be as accommodating as possible. Extended absences may, however, require additional documentation (e.g., note from a physician).
Provisionally, I have decided to allow students to use laptops and tablets in class. This is, however, highly conditional. If I observe students using their electronic devices for non-academic pursuits (e.g., shopping, consuming social media and so on), I will institute a sweeping ban on electronics. Do not be the one to contravene our social contract
On weekdays and non-holidays, I will respond to e-mails within 48 hours. If I fail to meet this standard, please send me a follow-up message with a gentle reminder. On weekends and breaks, I will not respond to e-mails unless you have an emergency. If you do, please include EMERGENCY in the subject line.
Assignments must be submitted on time. A late submission will result in a penalty of 5% for each day beyond the deadline. However, as noted, we are well aware that life can present unexpected challenges. If you anticipate missing a deadline or have an emergency, please inform us soon as you can. Extensions may be granted on a case-by-case basis.
Four Basic Expectations
Read carefully but efficiently.
During
Modules IIandIII, practice coding as often as you can.Participate in class conversations. We’ll all learn more that way.
Have fun!
Some Light Quantitative “Sociology”
Putting You on the Spot
y = \beta_0 + \beta_1 x + \epsilon
A Quick Question
How would you explain what a linear regression model is?A Silly Example
# A tibble: 344 × 8
   species island    bill_length_mm bill_depth_mm flipper_length_mm body_mass_g
   <fct>   <fct>              <dbl>         <dbl>             <int>       <int>
 1 Adelie  Torgersen           39.1          18.7               181        3750
 2 Adelie  Torgersen           39.5          17.4               186        3800
 3 Adelie  Torgersen           40.3          18                 195        3250
 4 Adelie  Torgersen           NA            NA                  NA          NA
 5 Adelie  Torgersen           36.7          19.3               193        3450
 6 Adelie  Torgersen           39.3          20.6               190        3650
 7 Adelie  Torgersen           38.9          17.8               181        3625
 8 Adelie  Torgersen           39.2          19.6               195        4675
 9 Adelie  Torgersen           34.1          18.1               193        3475
10 Adelie  Torgersen           42            20.2               190        4250
# ℹ 334 more rows
# ℹ 2 more variables: sex <fct>, year <int>
A Silly Example
Call:
lm(formula = bill_length_mm ~ flipper_length_mm, data = penguins)

Residuals:
    Min      1Q  Median      3Q     Max
-8.5792 -2.6715 -0.5721  2.0148 19.1518

Coefficients:
                  Estimate Std. Error t value Pr(>|t|)
(Intercept)       -7.26487    3.20016   -2.27   0.0238 *
flipper_length_mm  0.25477    0.01589   16.03   <2e-16 ***
---
Signif. codes:  0 '***' 0.001 '**' 0.01 '*' 0.05 '.' 0.1 ' ' 1

Residual standard error: 4.126 on 340 degrees of freedom
  (2 observations deleted due to missingness)
Multiple R-squared:  0.4306,    Adjusted R-squared:  0.4289
F-statistic: 257.1 on 1 and 340 DF,  p-value: < 2.2e-16
A Silly Example
Show the underlying code
library(marginaleffects)

avg_predictions(basic_model,
                variables = "flipper_length_mm") |>
as_tibble() |>
ggplot(mapping = aes(x = flipper_length_mm, y = estimate)) +
geom_line(colour = "#b7a5d3", linewidth = 1.1) +
geom_ribbon(mapping = aes(ymin = conf.low,
                          ymax = conf.high),
            alpha = 0.1) +
theme_bw() +
labs(x = "Flippper Length (mm)",
     y = "Predicted Bill Length (mm)") +
theme(panel.grid.minor = element_blank()) 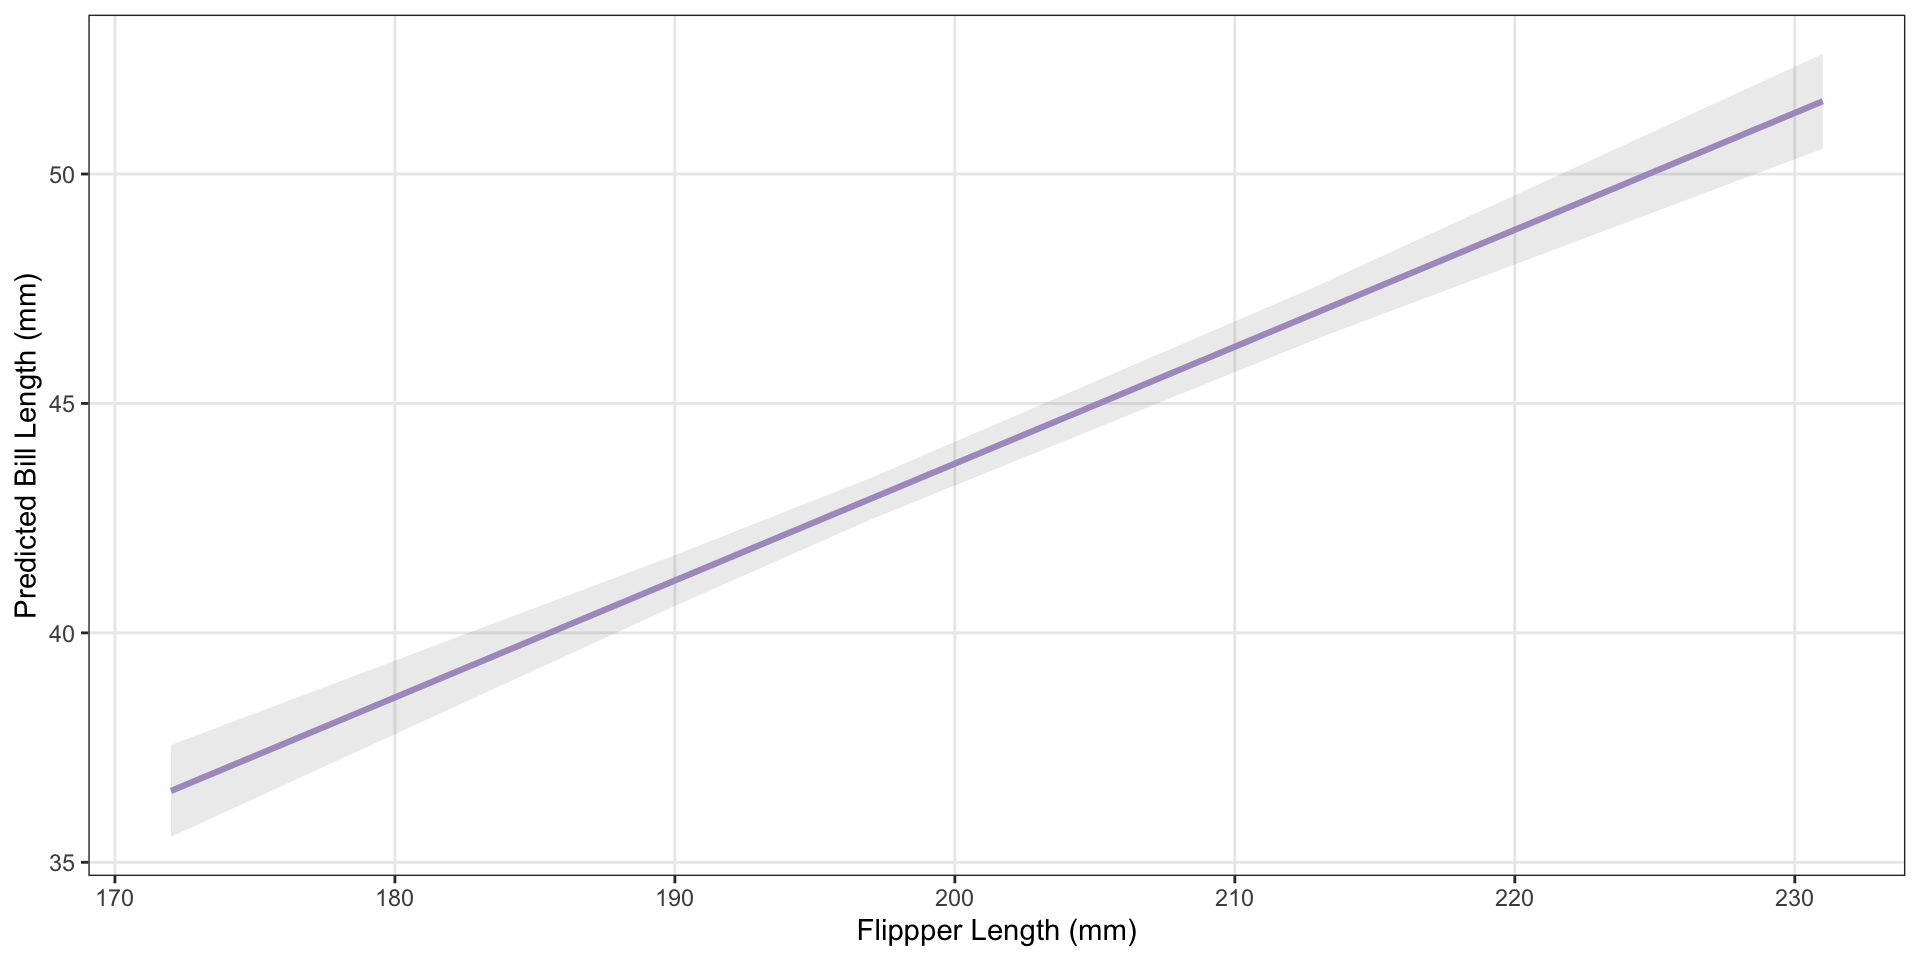
A Silly Example
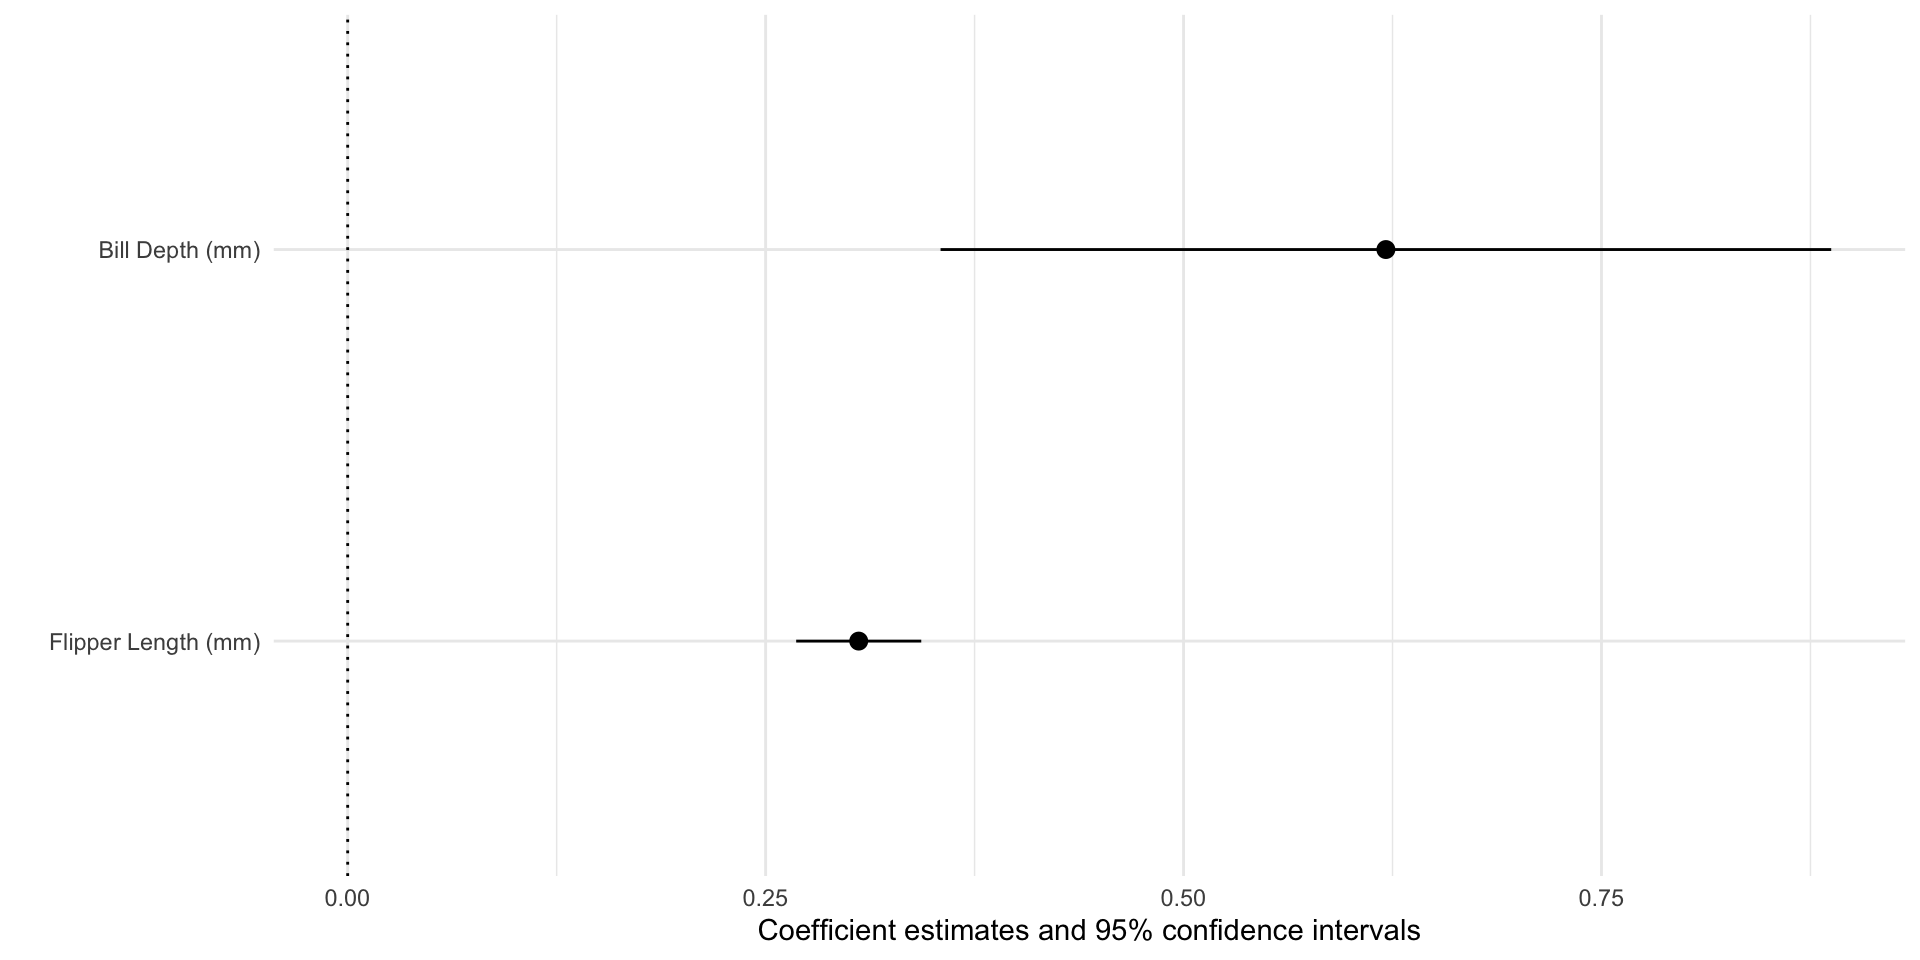
Adding Another Predictor
Show the underlying code
So, What’s the Issue?
To use such a model to actually represent social reality, one must map the processes of social life onto the algebra of linear transformations. This connection makes assumptions about social life—not the statistical assumptions required to estimate the equations, but philosophical assumptions about how the social world works.
(Abbott 1988:170, EMPHASIS ADDED)
So, What’s the Issue?
Such representational use assumes that the social world consists of fixed entities (the units of analysis) that have attributes (the variables). These attributes interact, in causal or actual time, to create outcomes, themselves measurable as attributes of the fixed entities. The variable attributes have only one causal meaning (one pattern of effects) in a given study, although different studies may assign similar attributes different meanings. An attribute’s causal meaning cannot depend on the entity’s location in the attribute space (its context), since the linear transformation is the same throughout that space. For similar reasons, the past path of an entity through the attribute space (its history) has no influence on its future path, nor can the causal importance of an attribute change from one entity to the next. All must obey the same transformation.
(Abbott 1988:170, EMPHASIS ADDED)
So, What’s the Issue?
Abbott’s (1988) foundational insights illustrate the value of quantitative sociology in the here and now.
Enjoy the Weekend
References
Note: Scroll to access the entire bibliography